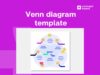
Try out Venn Diagrams for easy problem solving
Venn diagrams are a simple yet effective tool to visualise logical relationships between different groups of information. They clearly illustrate how items are similar or different. They’ve found their place in the business world, helping to solve and illustrate complex problems in a clear, visual manner. Use our editable Venn Diagram template and guide to easily create your own Venn diagrams.
Venn diagrams are a simple yet effective tool to visualise logical relationships between different groups of information. They clearly illustrate how items are similar or different. They’ve found their place in the business world, helping to solve and illustrate complex problems in a clear, visual manner. Use our editable Venn Diagram template and guide to easily create your own Venn diagrams.
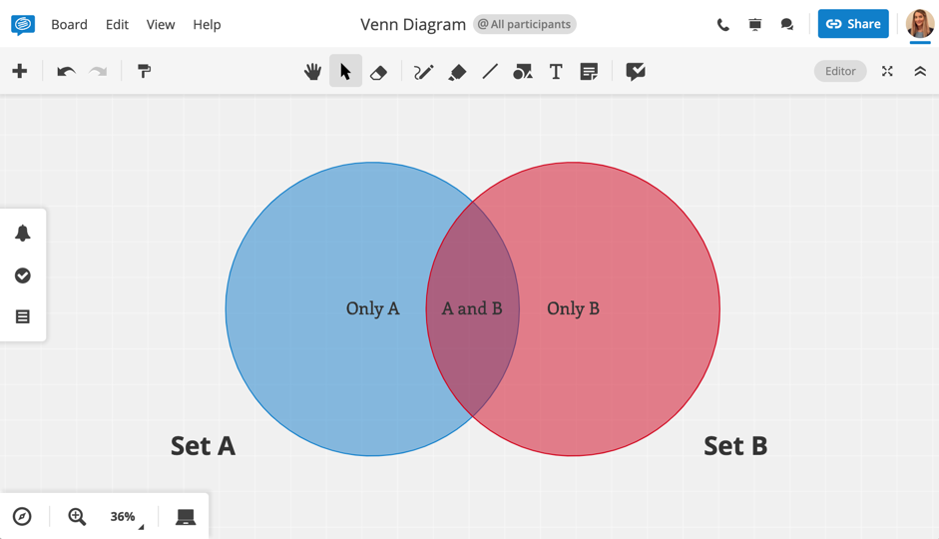
The basic Venn Diagram- 2 circles
At its most simple, there are two overlapping circles, each circle representing a set of items. The middle section shows what set A and set B have in common.
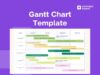
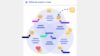
Three circle Venn Diagram Template
Venn Diagrams often represent two sets of information, but by adding more circles and thus more data segments, you can create more complex diagrams. This can help you explain in a clear visual way the interrelationship between many different related sets of information.
We’ve created a free template with three circles that you can use to help with a range of problems, such as identifying new business directions, defining a target market, and sharing results in reports. Get started now.
Create your own Venn Diagram with our template
Our Venn diagram template is extremely easy to use and share. Conceptboard‘s collaborative whiteboard allows you to add sticky notes to each area in the template, or simply add external images for better visualization. We’ve added some GIFs below to illustrate how easy it is to add content, create additional circles and export so you can share with your team or use in your presentation.
Adding sticky notes
The first step when it comes to creating a great Venn Diagram is the addition of sticky notes. With Conceptboard, you also have the option of adding external content to your charts and boards. Discover how here.
Adding a circle
Sometimes your diagrams are extra complex and 2 or 3 circles are just not good enough! Fret not, we’ve got you covered. Add as many circles (or whatever shape you choose) as you want.
Exporting & Sharing
Conceptboard allows you to invite your team members to your board and get their feedback and collaborate from within the app itself. In case you want to export your board and use it as a you have that option as well. Simply export as an image or PDF and use as you please!
How Venn Diagrams can help you solve problems
Venn Diagrams are an extremely effective way for you to organise and visualise the relationship between data sets. You can use them during brainstorming sessions to generate new ideas or product ideas, as well as in business reports and presentations to show results in a clear visual manner.
Three key ways it can be used are to:
- Compare two or more choices to determine what they have in common, what are their key differences, and which option is the better choice.
- Organise information in an easily digestible fashion.
- Help you focus on priorities by finding the key target area. In this simple example below, we have people who like to read on the left, and people who travel a lot for work or in their leisure time. So the overlapping section corresponds to people who enjoy reading AND travel a lot, and this specific combination makes them the ideal target group for e-readers.
Venn Diagrams for business purposes
While the possibilities are endless when it comes to what you can do with a Venn Diagram, we have pulled together a few key use cases you might want to try.
Use case: Market analysis
You can narrow down your key target audience using a Venn Diagram. By placing the different facts about your customers in separate circles, the section where they all overlap, will be the absolute ideal customer, and the person you should be targeting with your marketing efforts.
Use case: The customer journey
It takes a lot of work to keep your customers happy and to retain them. So if you can identify the key things they are looking for and plot it in a Venn Diagram, it’ll help you identify what you need to secure them as a long-term customer.
Choosing a dream job
Forget the long career quizzes, a Venn Diagram is the tool that will help you identify your dream job. Label three circles with Jobs I Love; Jobs That Pay Well; and Jobs I Can Do, then start filling them out. If any jobs find themselves in all three sections, then that’s probably something you should look more into.
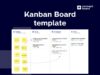
Get started with a free Conceptboard template
We’ve created a huge range of other free templates on our blog such as the Business Model Canvas, Fishbone Diagram and the Kanban Board. Start your free 30-day trial now and elevate your collaboration.