5 Steps guide of how to use a fishbone diagram | free template
Create your own fishbone analysis with this simple online fishbone diagram template. Remote or distributed teams can use the template to collaborate in real-time with ease.
What is a fishbone diagram (Ishikawa diagram)?
A fishbone diagram (also known as an Ishikawa Diagram) is a visual way to look at cause and effect. Its structured, visual layout can help with brainstorming possible causes of a problem.
When conducting a fishbone analysis, teams work together to brainstorming and categorize factors contributing to a problem. Using a fishbone diagram template can help in identifying root problems rather than just symptoms. It’s especially powerful as a collaborative exercise as it directs teams to consider new, alternative causes.
Use a fishbone diagram template online
Create your own fishbone analysis with this simple online fishbone diagram (Ishikawa diagram) template. Remote or distributed teams can use the template to collaborate in real-time with ease. Simply click on the template below and get started right away, or follow the five-step guide below.
Five-step guide
- The first and most important step is to gather your team. Invite anyone who could help shed light on the problem at hand. Using the free online template will ensure remote and distributed teams can collaborate with ease.
- Focus your session on the exact problem by first identifying your Problem Statement. Framing it as a ‘why’ question will help you find answers.
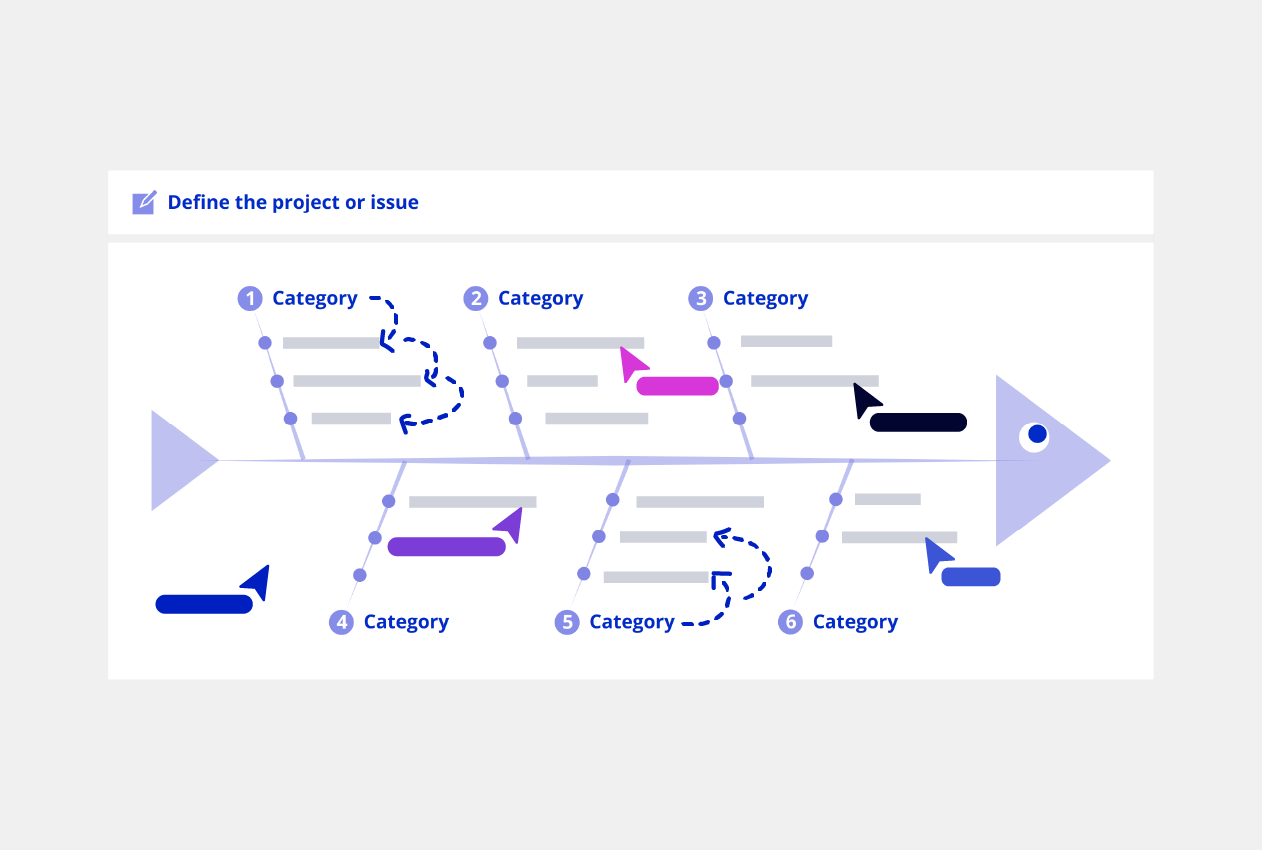
- Start thinking about the main categories related to this problem. This might be staff, software, marketing, budget, equipment, legal. Write these labels in the large category boxes at the top of the fish bones.
- Along the fish bones, note down all the contributing causes related to the main problem in the corresponding category. Consider the 4P’s: Policies, Procedures, People and Plant for each category.
- Continue identifying all the root causes of all the problems. Within your team, analyse the diagram and decide on the next steps to deal with these issues.
When to use a fishbone diagram (Ishikawa diagram)
As a project management tool, a fishbone diagram is most useful in product development and troubleshooting.
As one of seven tools within the quality control tool chest, the fishbone diagram can help projects progress. When teams hit a roadblock and are unable to identify the cause, they may need to look deeper at the underlying issues. A fishbone analysis will encourage teams to identify underlying problems they weren’t even aware of.
Many industries use a fishbone analysis to examine an incident report. It will help identify the root cause of an accident, ensuring it can be avoided in the future.
Similarly, risk managers use a fishbone diagram to identify causes for concern and improve processes.
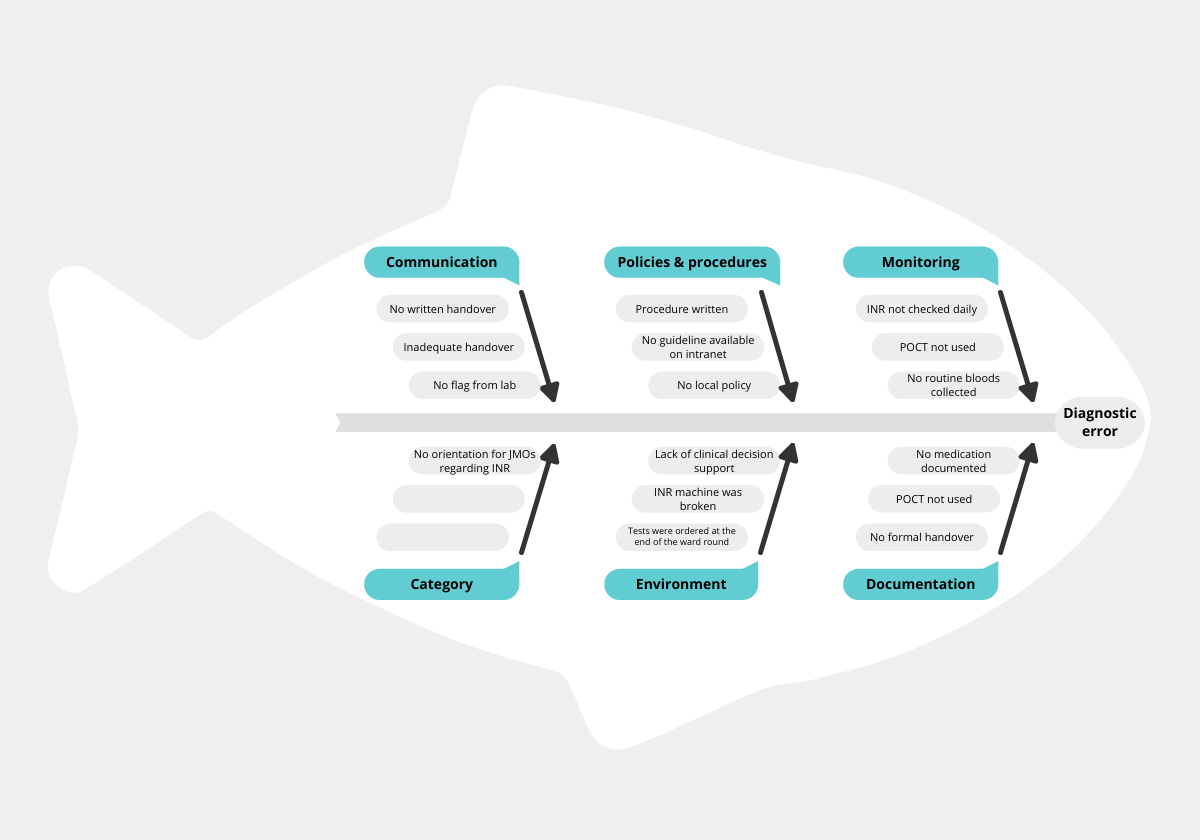
Examples of a fishbone diagram
We’ve created a fishbone diagram example to help you understand what a completed template looks like. The example is based on finding a diagnostic error in the field of medical science.
Explore problem-solving further with Sakichi Toyoda’s 5 Why’s technique. It is designed to help get to the core of the problem.
If you’d like to explore additional brainstorming techniques, we’ve rounded up 15 brainstorming techniques and templates you can use with your team.