What is the BCG Matrix?
The BCG matrix or the growth share matrix in its essence is a portfolio management framework that enables companies to manage their product lines. If you work as a product/brand manager in a medium to large scale organization, chances are your company has a number of products in its portfolio. These products are organized into various categories on the basis of attributes such as price positioning(popular, premium, luxury), quality perception, functionality etc. For companies in industries such as FMCG, or consumer durables, this portfolio can be extremely wide and complex.
As product or category manager, one of your biggest challenges is portfolio management. How do you decide what products/variants should be retained, which ones to deprioritize and which ones to discontinue altogether? This is where the BCG matrix comes in handy. Created in 1968 by BCG’s founder, Bruce Henderson, this helpful, visual framework has since garnered global acclaim and become an essential tool in a product manager’s strategy toolkit.
In this article, we present to you a ready made template for the BCG matrix as well as basic guidelines that help you analyse your product portfolio in a visual, easily understandable layout.
How to use a BCG matrix?
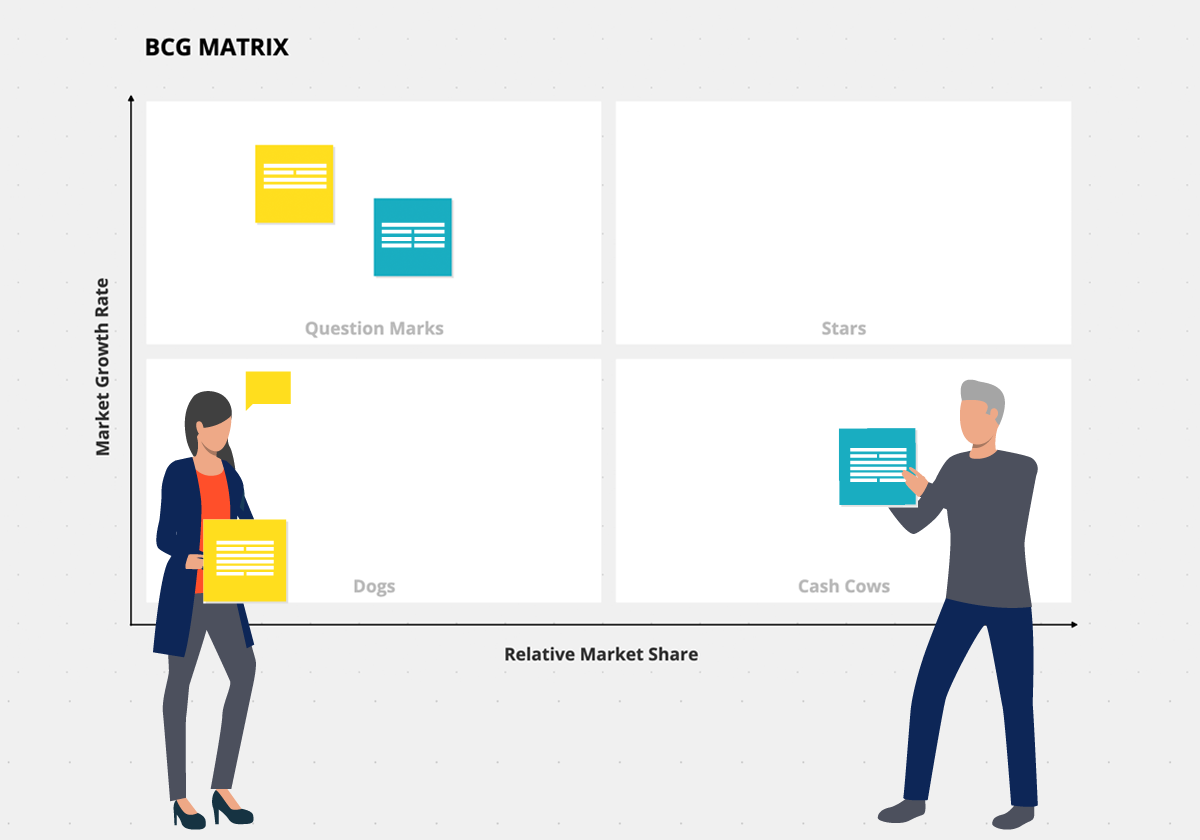
The idea that underpins the BCG Matrix is that there are 2 large determinants of product success. Growth and market share. Growth is the rate at which the particular market is growing. Market share is the market share of the product relative to competition. In the matrix, these two metrics are represented along the two axes. The product portfolio is then plotted onto the chart. Let us now break down the resulting 4 quadrants.
-
- Cash Cows (Low growth market, high market share) – These are the products that have a high market share in a low-growth industry or category. The ROI associated with these products is generally high since marketing monies are typically not invested in slow growing or ‘mature’ industries. These products are ‘milked’ for as much revenues as can be generated and the resulting cash flow is then invested in faster-growing categories.
- Dogs (Low Growth market, Low Market Share) – These low-share products in a mature industry barely generate any profitability. Unless these have some kind of strategic importance for the company, eg. Visibility, establish presence or a flanking strategy these should eventually be discontinued.
- Stars(High market growth, high market share) – These are products that have the highest future potential. Constant investment in these are required to fight off competition and maintaining market share. Once the market growth slows, the goal is for these to become cash cows.
- Question Marks(High growth market, low market share) – The non-obvious nature of these ‘question marks’ means that these need to be carefully analysed. Investing in these might turn them into stars and eventually cash cows or if they fail to take hold, they could degenerate into dogs.
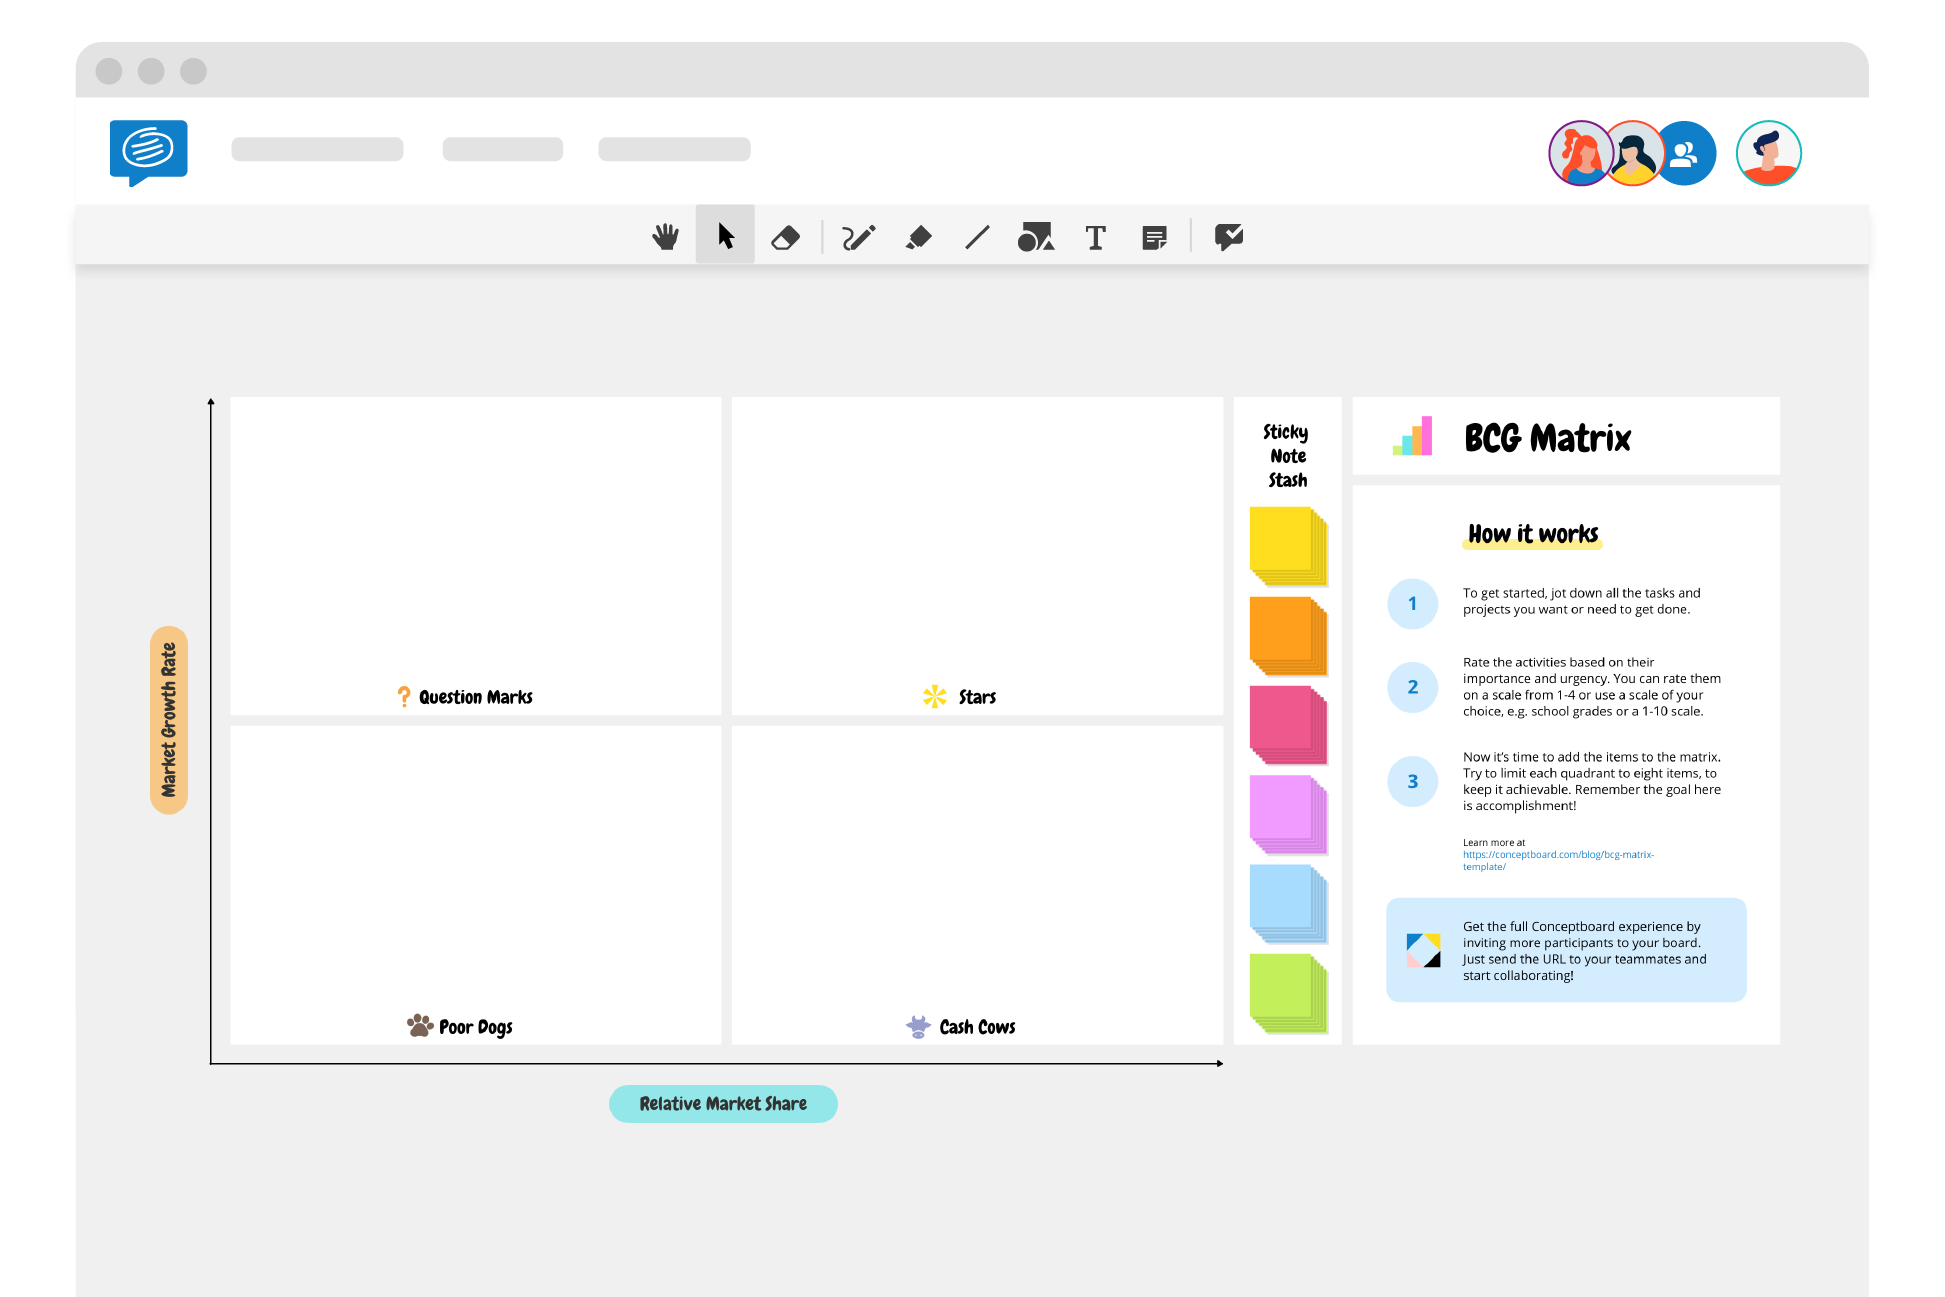
BCG Matrix: A visual overview
Like other strategic frameworks such as SWOT or Pestel, the greatest strength of the BCG matrix template is its simplicity and ease of use. It affords you the ability to lay out complex information visually. This can then be circulated among teams and even with senior management as an easily understandable snapshot of your portfolio.
Tools such as Conceptboard help you map out abstract information in a visual format that is visually appealing, easy to use and easier to understand. Discover all the templates we offer and try them for free today on Conceptboard!