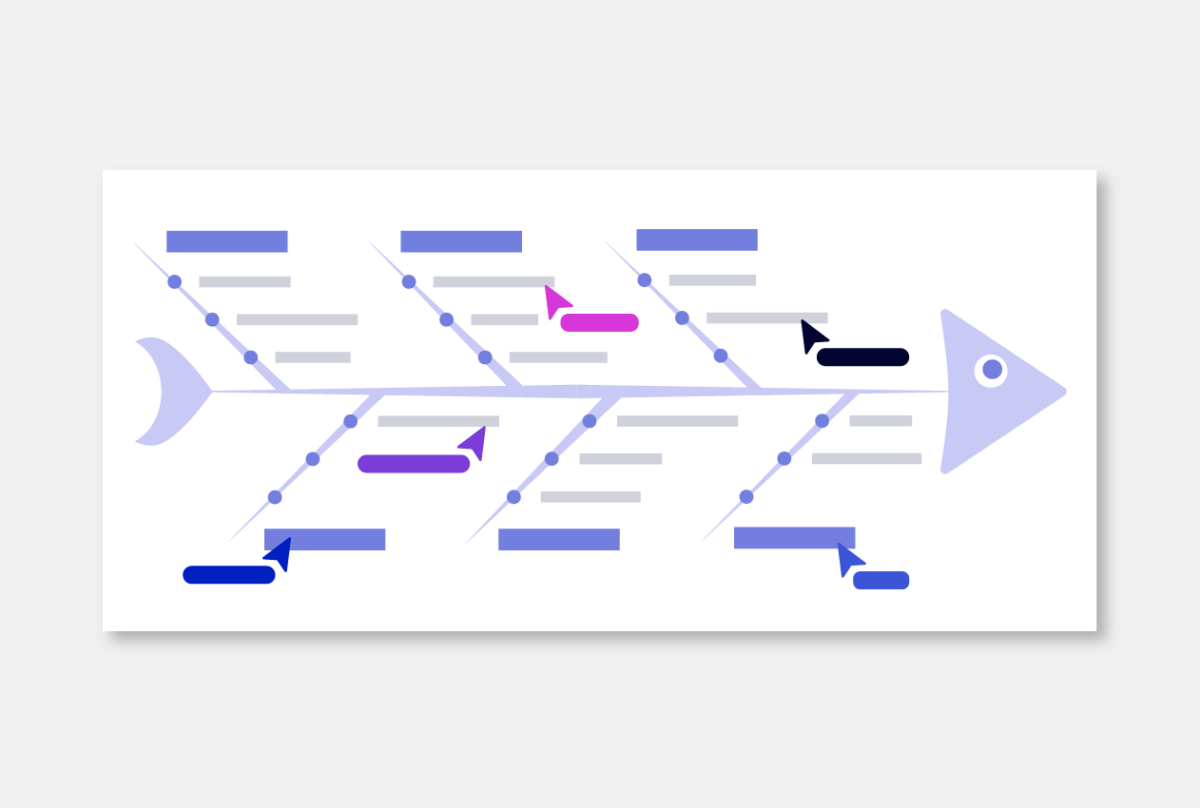
A Fishbone Diagram (Ishikawa Diagram) is a useful tool for cause-effect analysis. Use this free fishbone diagram template on Conceptboard.
Experience how Conceptboard boosts your team’s
collaboration and communication.
Join us at Smart Country Convention from 15th to 17th October in Berlin. Read more
A Fishbone Diagram (Ishikawa Diagram) is a useful tool for cause-effect analysis. Use this free fishbone diagram template on Conceptboard.