This post is also available in: German
We’ve all been there, managing a project successfully can be difficult. Tasks need to be coordinated across team members, and before you know it, the deadline is tomorrow, and you’re still nowhere near to finishing the project.
To make sure that doesn’t happen, project managers often turn to Gantt charts as their project management tool. It’s a type of bar chart that breaks down the entire project into chunks of work, or phases, and shows the progression of work over time.
Benefits of Using a Gantt Chart
Gantt charts can be used for just about any type of project, from planning a marketing campaign to getting ready for a product launch. When executed properly, they are a great way to visually plan out a project. They help to identify potential bottlenecks in the project, as well as, to make it easier to identify tasks that may have been overlooked in the original planning.
They also help establish timeframes and show team members how their work relates to one another. Tasks often depend on each other, and it can be tough to figure out how long one task will take and when to start it.
1. Time Overview
Gantt charts provide a clear chronological overview of all tasks and activities in a project. This allows team members and stakeholders to grasp the project’s progress at a glance without delving into extensive reports.
2. Task Dependencies
Gantt charts illustrate task dependencies. This means you can see which tasks must be completed before others and which tasks can run concurrently. This helps identify bottlenecks and delays early on and allows for effective management.
3. Resource Planning
You can integrate resources such as personnel, budgets, and materials into your Gantt chart. This streamlines resource planning and allocation as you can directly assign them to specific tasks.
4. Progress Tracking
During the project, you can update the progress of individual tasks within the Gantt chart. This allows for real-time tracking of the current status and ensures the project stays on course.
5. Communication
Gantt charts serve as an excellent communication tool. They enable effective sharing of project progress, timelines, and milestones with team members and stakeholders, promoting transparency and ensuring everyone is on the same page.
6. Risk Management
By clearly depicting tasks and dependencies, potential risks and bottlenecks can be identified early. This enables timely measures to keep the project on track.
7. Efficiency Enhancement
Using Gantt charts can significantly boost overall project management efficiency. By structuring tasks clearly and optimizing timelines, you can make more effective use of time and resources.
How to use a Gantt Chart Template
In Gantt charts, the left side of the chart is a list of the important project tasks, and along the top of the chart is a timeline.
Each task is represented by a bar, and the position and length of the bar shows the duration, and the planned start/end of each task. This gives the team a better perspective of the total project and the required timeframe.
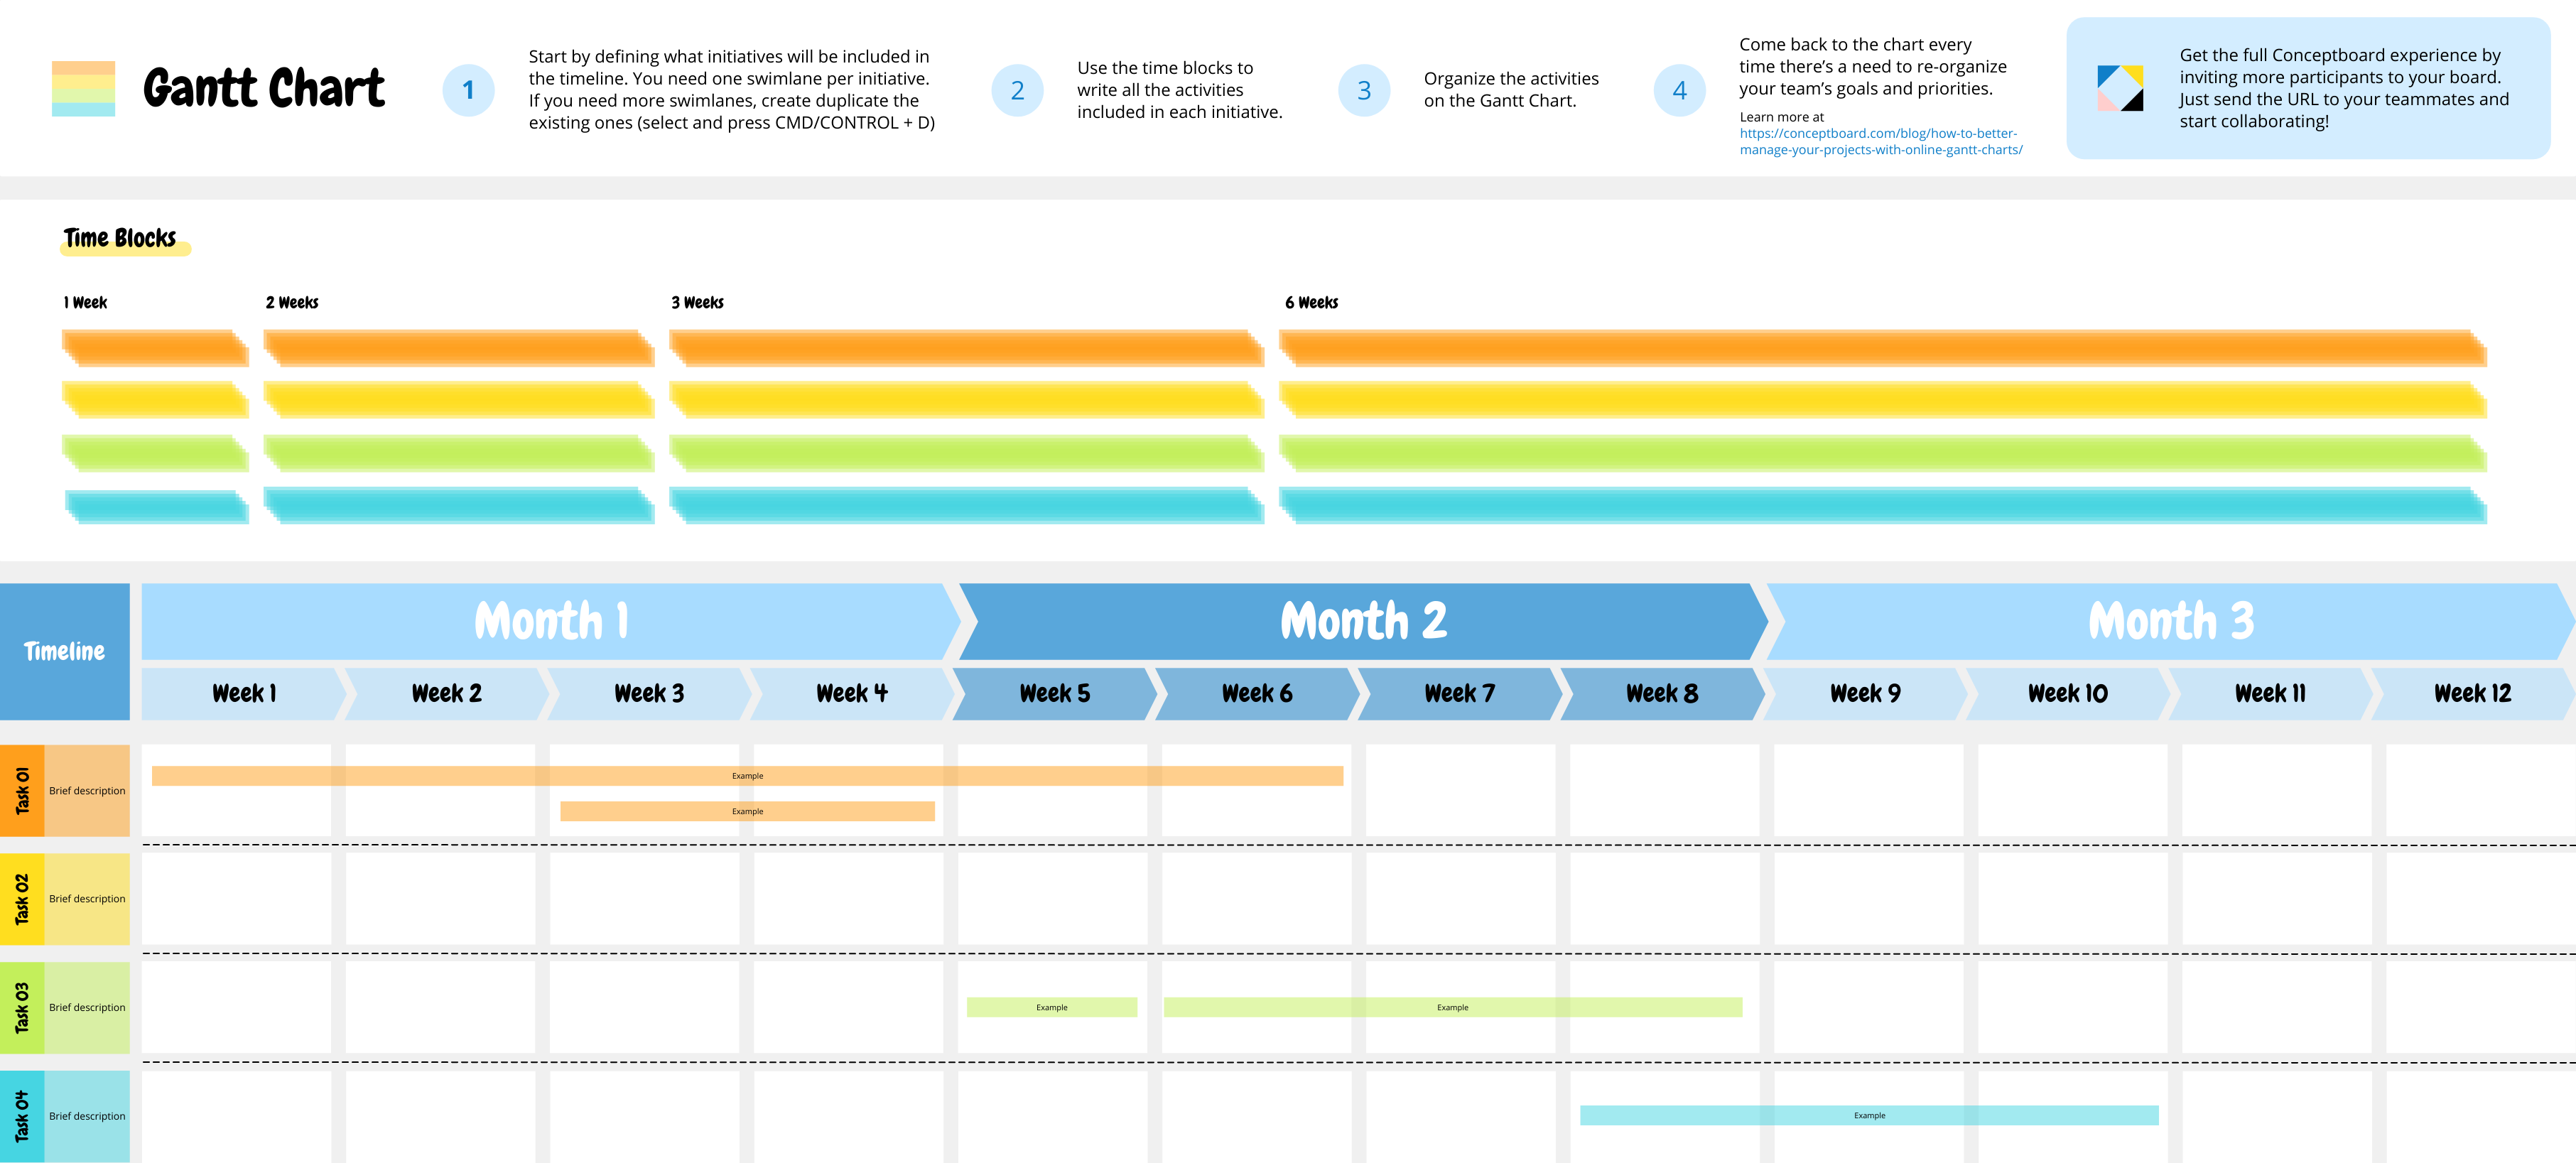
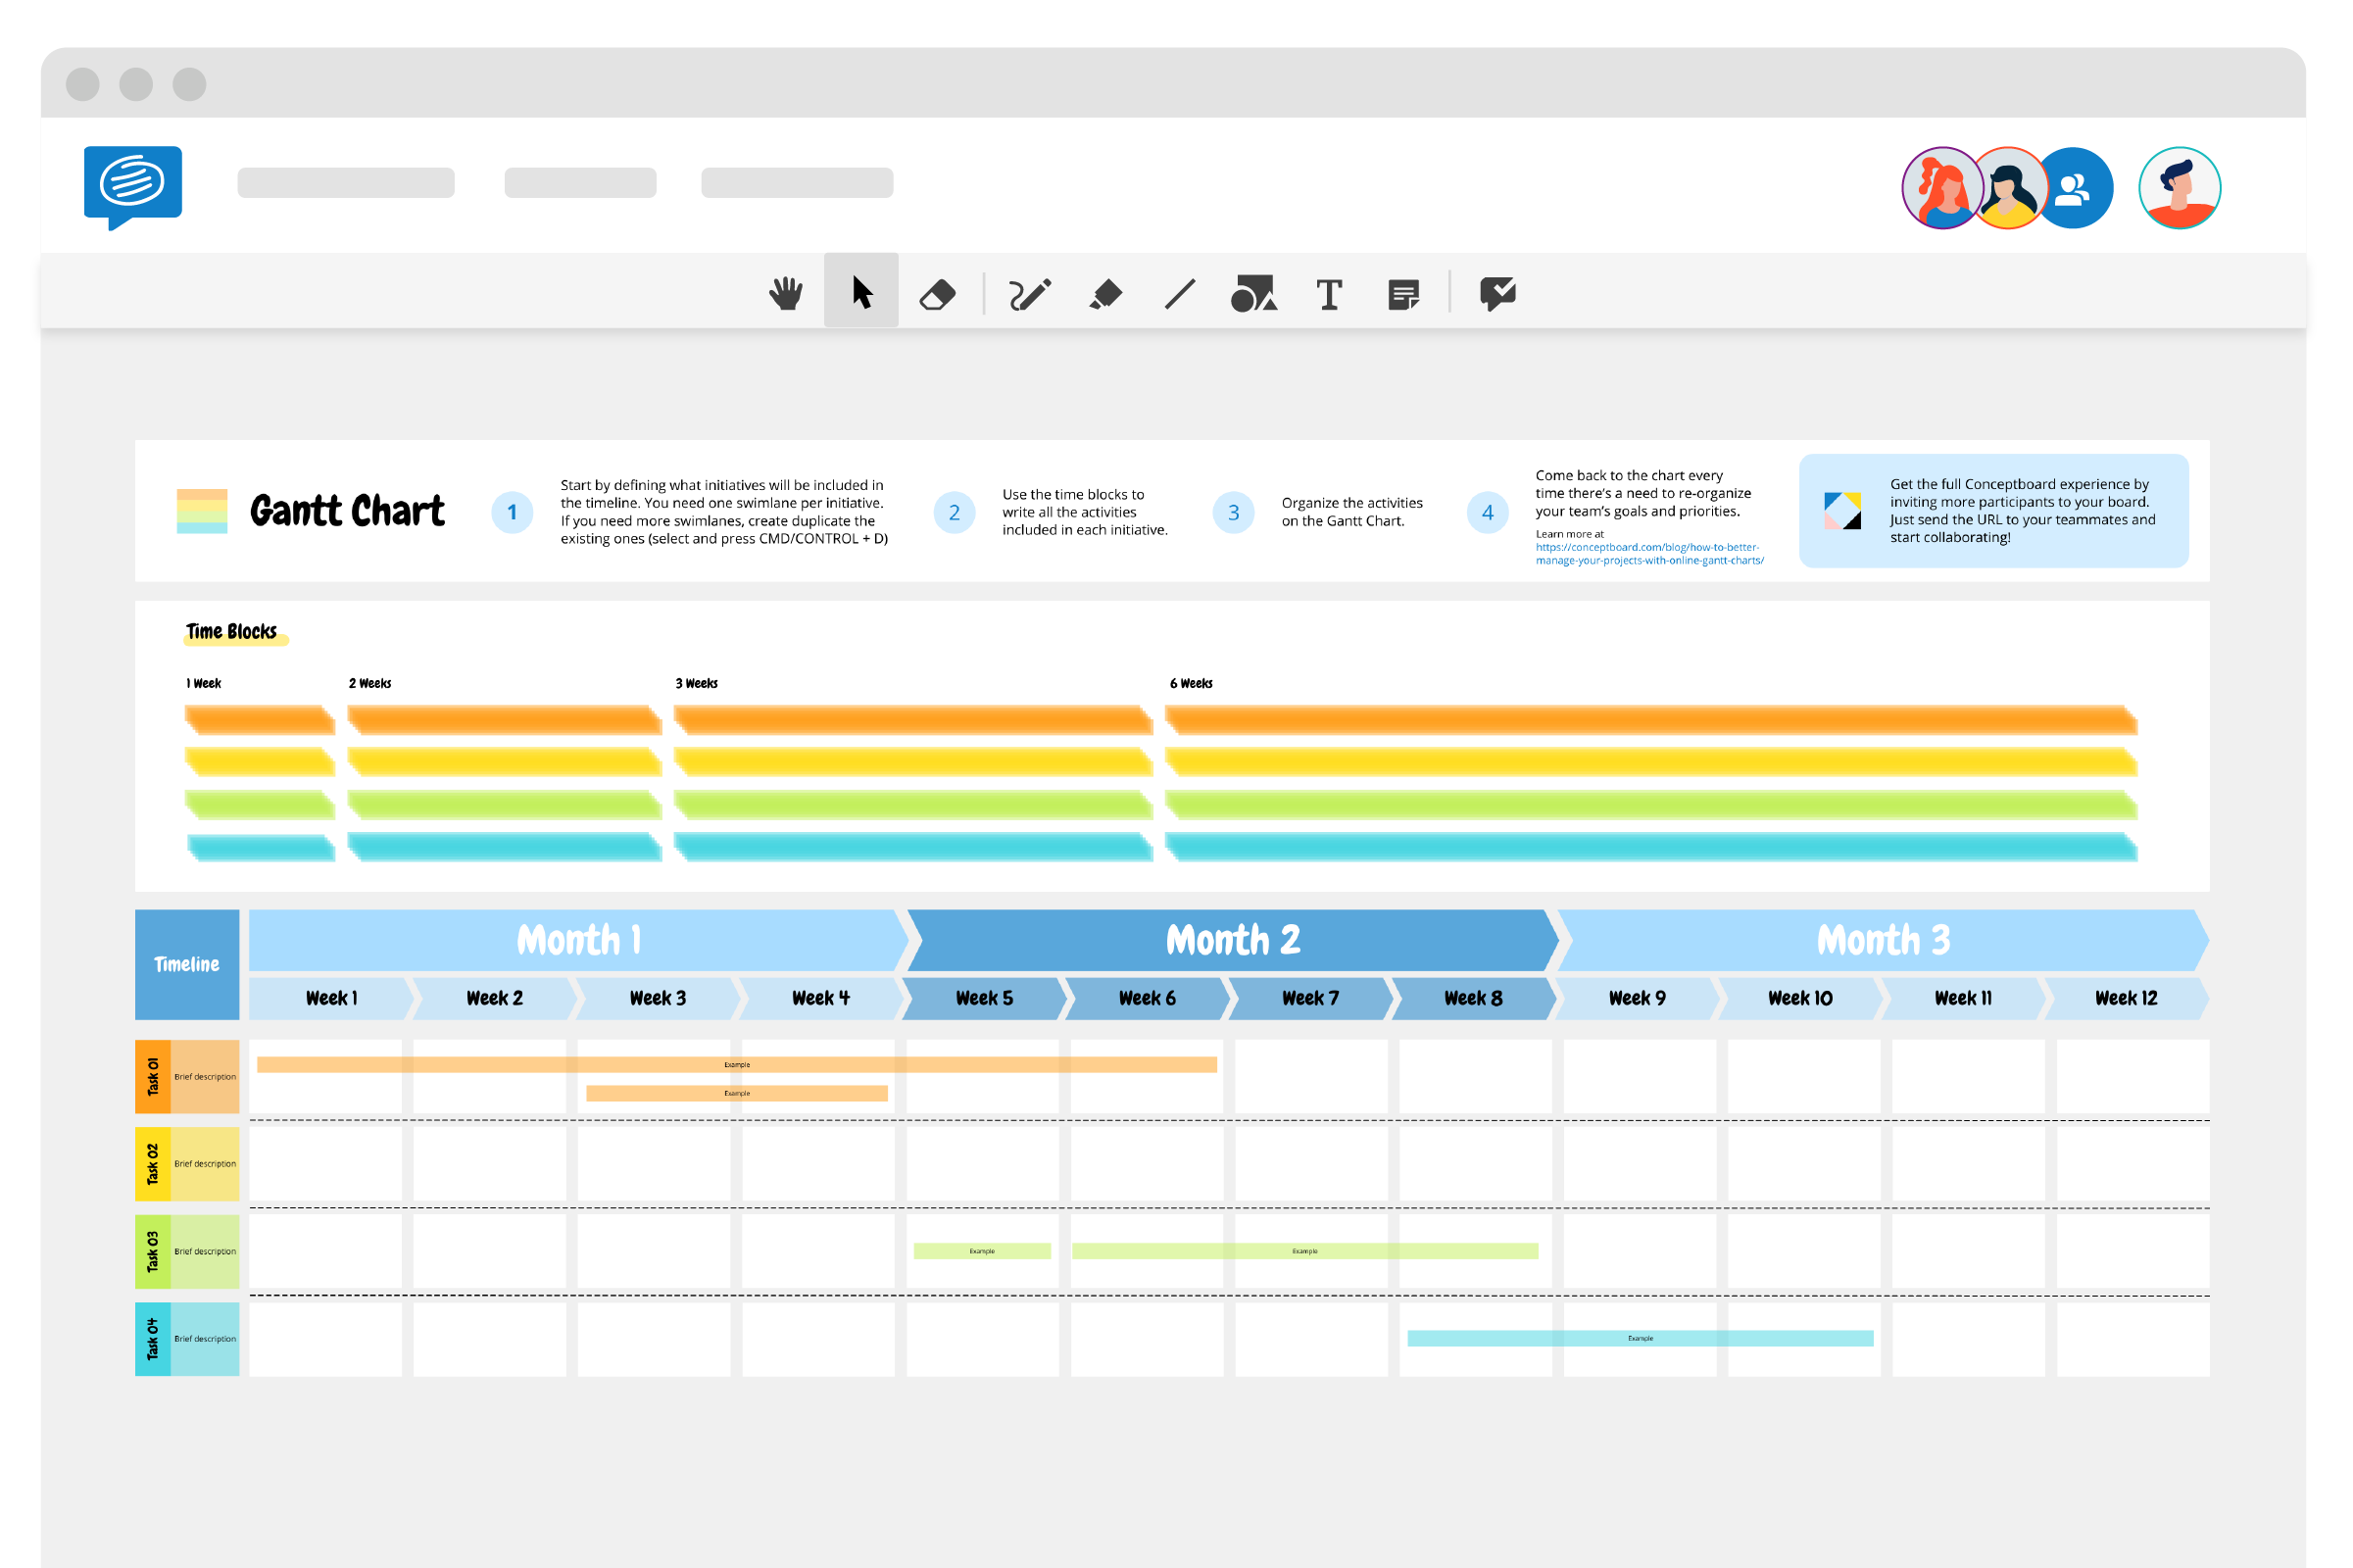
Being able to see a visual schedule, will ensure that the project doesn’t fall behind. All participants can stay updated on the progress, and when it seems that the deadline won’t be met, alterations can be done to ensure the final product will be finished. Especially when projects are complex, you can end up spending too much time filling in and updating task details, when all you need is a clean visual to keep your team on track.
In summary, Gantt charts provide a comprehensive view of a project, aid in planning and tracking, facilitate effective communication, and contribute to better project control. They are a versatile tool that can add value in nearly every project management context.
Create a Gantt Chart for your next project in Conceptboard with the help of the template above! Once you are done planning, you can insert supported files directly next to the schedule, keeping everything in one place, to start collaborating with your team right away.

1 Comment. Leave new
Hi! I am considering adopting Conceptboard for our startup. However, most of the templates or building blocks seems like they are just drawings without real input interfaces. When I insert this Gantt Chart template, as I move it the progress bars are lost in the way. Meaning there is no integrated program behind it.
Am I missing something? Do you have any integration with any of the major project manager platforms like Monday, Asana, etc.?
Thanks!