Value Stream Management Made Easy: Boost Process Efficiency with Conceptboard
Whether in manufacturing, development, or supply chains—wherever processes are complex, distributed, and regulated, Value Stream Mapping (VSM) can deliver real efficiency gains. If your goal is to reduce lead times, allocate resources more effectively, and align cross-functional teams, VSM is essential. With a digital whiteboard like Conceptboard, your entire value stream becomes visible—in real time, impactful, and GDPR-compliant.
What is Value Stream Management?
Value Stream Management (VSM) is a method rooted in Lean principles. Its goal is to make the entire flow of activities—from order to delivery—transparent and to systematically eliminate all non-value-adding elements.
This typically happens in two steps:
- Mapping the Current State
Visualization of all process steps, including timeframes, stakeholders, and wait times. - Designing the Future State
Identifying waste, uncovering optimization potential, and prioritizing improvements.
The result: Shorter lead times, leaner processes, and clearer responsibilities.
When is VSM worthwhile?
VSM is especially beneficial when:
- Processes span multiple locations, departments, or partners
- Teams work with sensitive information or in highly regulated industries
- Decision-making is slow and friction is noticeable
- Improvement initiatives stall due to lack of transparency
- Processes are to be automated or digitized, but the current state is unclear
VSM with Conceptboard: Collaborative & Secure
With Conceptboard, teams can map out their entire value streams directly on a central visual workspace—regardless of whether they are remote or on-site. Processes are not just represented visually but can be collaboratively analyzed, commented on, and improved in real time.
Key Benefits:
- Visual representation of complex process flows (materials & information)
- Unlimited canvas for comprehensive value stream analysis
- Commenting features for cross-functional collaboration
- Role- and access-based control for sensitive data
- Revision history for full traceability
- GDPR-compliant hosting & ISO 27001/17/18 certified
💡 Tip: For detailed modeling of individual process steps, check out our BPMN template.
Practical Optimization: Typical KPIs for Your Value Stream
To effectively design and measure a value stream, keep an eye on these key metrics:
- Lead Time (Time from start to delivery)
- Cycle Time (Actual processing time)
- %C/A (Process quality: percentage of steps done right the first time)
- Value-Added Time (Time that directly adds value to the product or service)
- Activity Ratio (Ratio of processing time to total duration)
These KPIs can be directly integrated into Conceptboard and visualized using icons or number fields.
Value Stream Mapping in Industry – 5 Steps to Process Optimization
Step 1: Define Objectives and Scope
The first step is to determine which process or value stream will be analyzed. The scope of the review should be clearly defined — for example, the entire production process or a specific sub-process. Clear objectives, such as reducing lead times, optimizing costs, or improving quality, provide the basis for the analysis. Involving relevant stakeholders ensures alignment across all parties.
Step 2: Data Collection and Process Analysis
Accurate value stream analysis requires collecting all relevant current-state data, including:
- Material and information flows
- Processing times and waiting times
- Inventory levels at each process step
- Bottlenecks and interdepartmental interfaces
- Customer requirements and delivery times
Digital data collection, connected machinery, and Industry 4.0 technologies enable detailed and up-to-date process insights.
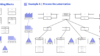
Step 3: Create the Current-State Value Stream Map
The collected information is visualized in a Value Stream Map. This includes:
- Depiction of all process steps using standard symbols
- Representation of material and information flows with arrows
- Marking of handovers, waiting times, and bottlenecks
- A timeline showing processing and delivery durations
This visualization creates transparency across the entire production flow.
Current State Map: Value stream visualization with KPIs
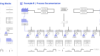
Step 4: Develop the Future State and Identify Improvements
Based on the current-state analysis, areas without added value — where waste (Muda) occurs — are identified. Common types of waste include overproduction, waiting, unnecessary transportation, excessive inventory, or rework.
The future state is designed to improve process flow, eliminate bottlenecks, and reduce lead times. Prioritization tools, such as a prioritization matrix, help select the most impactful measures.
Step 5: Implementation and Continuous Improvement
Once the future state is defined, an implementation plan is developed, detailing actions, responsibilities, timelines, and resources. Progress is regularly monitored, and the Value Stream Map is updated whenever processes change.
A continuous improvement process (CIP) ensures that efficiency gains are sustained over the long term.
Future State Map: Optimized flow with reduced lead time
Tip:
When documenting a complex process, the Conceptboard building blocks can be used. They can be found in the menu under “Insert Content” > “Insert Building Blocks.”
A wide variety is available, including:
- Activities
- Events
- Gateways
- Data Objects
- Choreographies
To explore more templates and features, start the 30-day trial period and take advantage of the Conceptboard Premium version.
Data Security Is a Must—Not a Nice-to-Have
For many companies—especially in heavily regulated industries like mechanical engineering, energy, or safety-critical manufacturing—data security is non-negotiable.
Conceptboard meets the highest security standards:
- Hosting exclusively in Germany
- ISO 27001, 27017 & 27018 certified
- Data Center Edition with on-premises installation or private cloud hosting
- No vendor lock-in to U.S. cloud providers
Conclusion: Make Your Value Streams Visible—Securely and at Scale
Whether you’re managing a production line, development process, or multi-site project, digital VSM with Conceptboard helps you gain transparency, enhance communication, and sustainably optimize your operations.