How teams plan complex projects – including a template to try
The project is planned at least on paper. The tasks are defined, the timeline seems realistic, and everyone involved knows what to do. But as soon as execution begins, the first uncertainties arise: Which task needs to be completed first? What happens if one step is delayed? And how does that affect the overall plan? What initially seemed like a clear project quickly turns into a complex interplay.
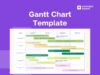
This is exactly where Gantt charts help. They enable teams to plan projects visually, understand dependencies, and present timelines transparently.
In this article, you will learn:
- what a Gantt chart is and how it works
- how teams use Gantt charts in practice
- how to create a Gantt chart
- how to get started immediately with a free Gantt template
How a Gantt chart makes projects truly manageable
To understand why Gantt charts are so effective, it helps to look at a typical project. Imagine a company implementing a new system. The tasks are clear: define requirements, configure the system, run tests, and finally roll it out. At first glance, these steps may seem independent. In practice, however, they are closely interconnected.
Configuration can only begin once requirements have been defined. Testing is only possible once implementation is complete. And the rollout depends on all previous steps being successfully completed.
A Gantt chart makes these dependencies visible. Tasks are not only displayed side by side but are organized along a timeline and connected to each other. This fundamentally changes the project perspective. Suddenly, it’s no longer just about completing tasks, but about understanding which steps influence progress.
Teams can identify potential delays early and respond accordingly. A project is no longer just planned, it is actively managed.
Open the Gantt template now and start planning your project
Create tasks, arrange them along a timeline, and instantly see how your project fits together.
How to create a Gantt chart step by step
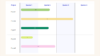
At first glance, creating a Gantt chart may seem complex, but in practice, it is often simpler than expected. What matters most is not the tool, but a clear structure. It always starts with the question: What tasks belong to the project? First, all relevant work steps are collected from initial planning to final execution. It’s important not only to define major milestones but also to make the individual steps in between visible.
Next, these tasks are arranged in a logical sequence. Which steps depend on each other? Which can run in parallel? This is where the basic structure of the Gantt chart is formed. Once the structure is in place, each task is assigned a timeframe. Teams determine when a task starts and how long it is expected to take. This automatically creates an initial visual timeline.
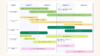
However, the real value of a Gantt chart emerges in the next step: dependencies. Tasks are linked so that it becomes clear which steps rely on each other and how delays will impact the project. This transforms a simple task list into a complete project plan.
In practice, many teams use a Gantt chart template to speed up this process. Instead of starting from scratch, they can work with an existing structure and adapt it to their project.
Open a Gantt template and structure your project
Use a pre-built Gantt chart template to plan tasks, define dependencies, and visualize your project.
How Gantt charts are used in real projects
The strength of Gantt charts becomes especially clear when multiple teams are involved and projects do not follow a linear path.
A classic example is the introduction of a new tool within a company. Different teams work in parallel on various aspects: IT handles the technical implementation, while HR develops training concepts and prepares internal communication. Without a clear structure, typical problems quickly arise. Teams start tasks that are not fully prepared. Dependencies are recognized too late, and timelines shift uncontrollably.
A Gantt chart brings order to this dynamic. Individual steps are displayed along a timeline and logically connected. This makes it immediately clear which tasks can run in parallel and which depend on each other. If a subproject is delayed, not only is the delay itself visible, but also its impact on subsequent steps. This allows teams to take corrective action early instead of reacting too late.
Especially in projects with many stakeholders, the Gantt chart becomes a central point of orientation. It does not replace collaboration, it makes it more structured and efficient.
Making planning understandable with Gantt even for complex processes
In environments with clearly defined processes, such as public administration or large organizations, transparency plays a crucial role.
Projects often go through fixed phases from planning and approvals to execution and control. Each step builds on the previous one and is often tied to specific conditions. Without visual representation, it quickly becomes difficult to maintain an overview. Tracking project status requires effort, and coordination becomes routine.
A Gantt chart provides a shared foundation. It not only shows the current phase of a project but also makes the entire process understandable. This makes planning more efficient and more transparent for both teams and stakeholders.
Get started quickly with a Gantt template
For many teams, getting started with Gantt planning initially feels complex. In practice, however, the challenge is rarely understanding the method it’s taking the first step.
Projects often begin with simple lists or tables that become increasingly confusing over time. A Gantt template offers a much easier entry point. It provides an initial structure that teams can follow and allows tasks to be planned directly along a timeline.
Within a short time, an initial project plan emerges; one that not only includes tasks but also makes their sequence visible. This plan can then be expanded and refined step by step.
Start your project with a ready-made Gantt template
Use the template and develop your own project plan from it.
When planning and collaboration come together
In many teams, planning does not happen in isolation. It emerges in meetings, workshops, or coordination between different stakeholders. This is often where one of the biggest challenges lies: planning and collaboration are separated. A Gantt chart becomes especially valuable when it is created directly where teams collaborate.
Imagine a team planning a project together. Ideas are collected, tasks are discussed, and priorities are set. When these steps are directly translated into a visual timeline, a continuous process emerges from the first idea to execution.
In Conceptboard, this type of planning can be mapped directly on the board. Tasks can be created in the context of discussions, moved, and adjusted while the overall project structure remains visible.
The result is not a static plan, but a living workflow that evolves collaboratively.
Connecting planning and execution: Gantt and Jira
Another common problem in projects is the separation between planning and execution. Planning happens in one tool, while tasks are executed in another system. This creates a gap that makes coordination more complex. A Gantt chart can close this gap by connecting tasks with time planning. When tasks from Jira are integrated into a timeline, a complete picture of the project emerges. Teams can see not only what is planned but also how far execution has progressed. Especially in complex projects, this leads to greater clarity and better decision-making.
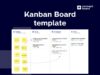
Gantt chart or Kanban – when to use which method
A Gantt chart is particularly suitable for planning projects with fixed phases and dependencies. Kanban boards, on the other hand, are ideal for daily work and ongoing tasks.
Many teams deliberately combine both approaches:
- Gantt for planning
- Kanban for execution
Both methods complement each other perfectly to organize tasks along a clear workflow. Read more in our blog: Understanding Kanban boards and try onw instantly with a template
Conclusion: structure Is the key difference in projects with Gantt
Gantt charts are more than just a planning tool. They help teams understand the full structure of projects and actively manage them.
Instead of isolated tasks, a coherent system emerges. One that makes it clear how projects truly function.
This not only improves planning but also provides greater confidence throughout the project lifecycle.