What is an Affinity Diagram?
Brainstorming is a great way to come up with creative ideas as a team. But it isn’t the most structured way to work with this board full of ideas and information, and at the end of the session teams may leave teams feeling frustrated if there are no clear takeaways. This is where an Affinity Diagram comes in (also known as an affinity chart or K-J method after its founder Kawakita Jiro).
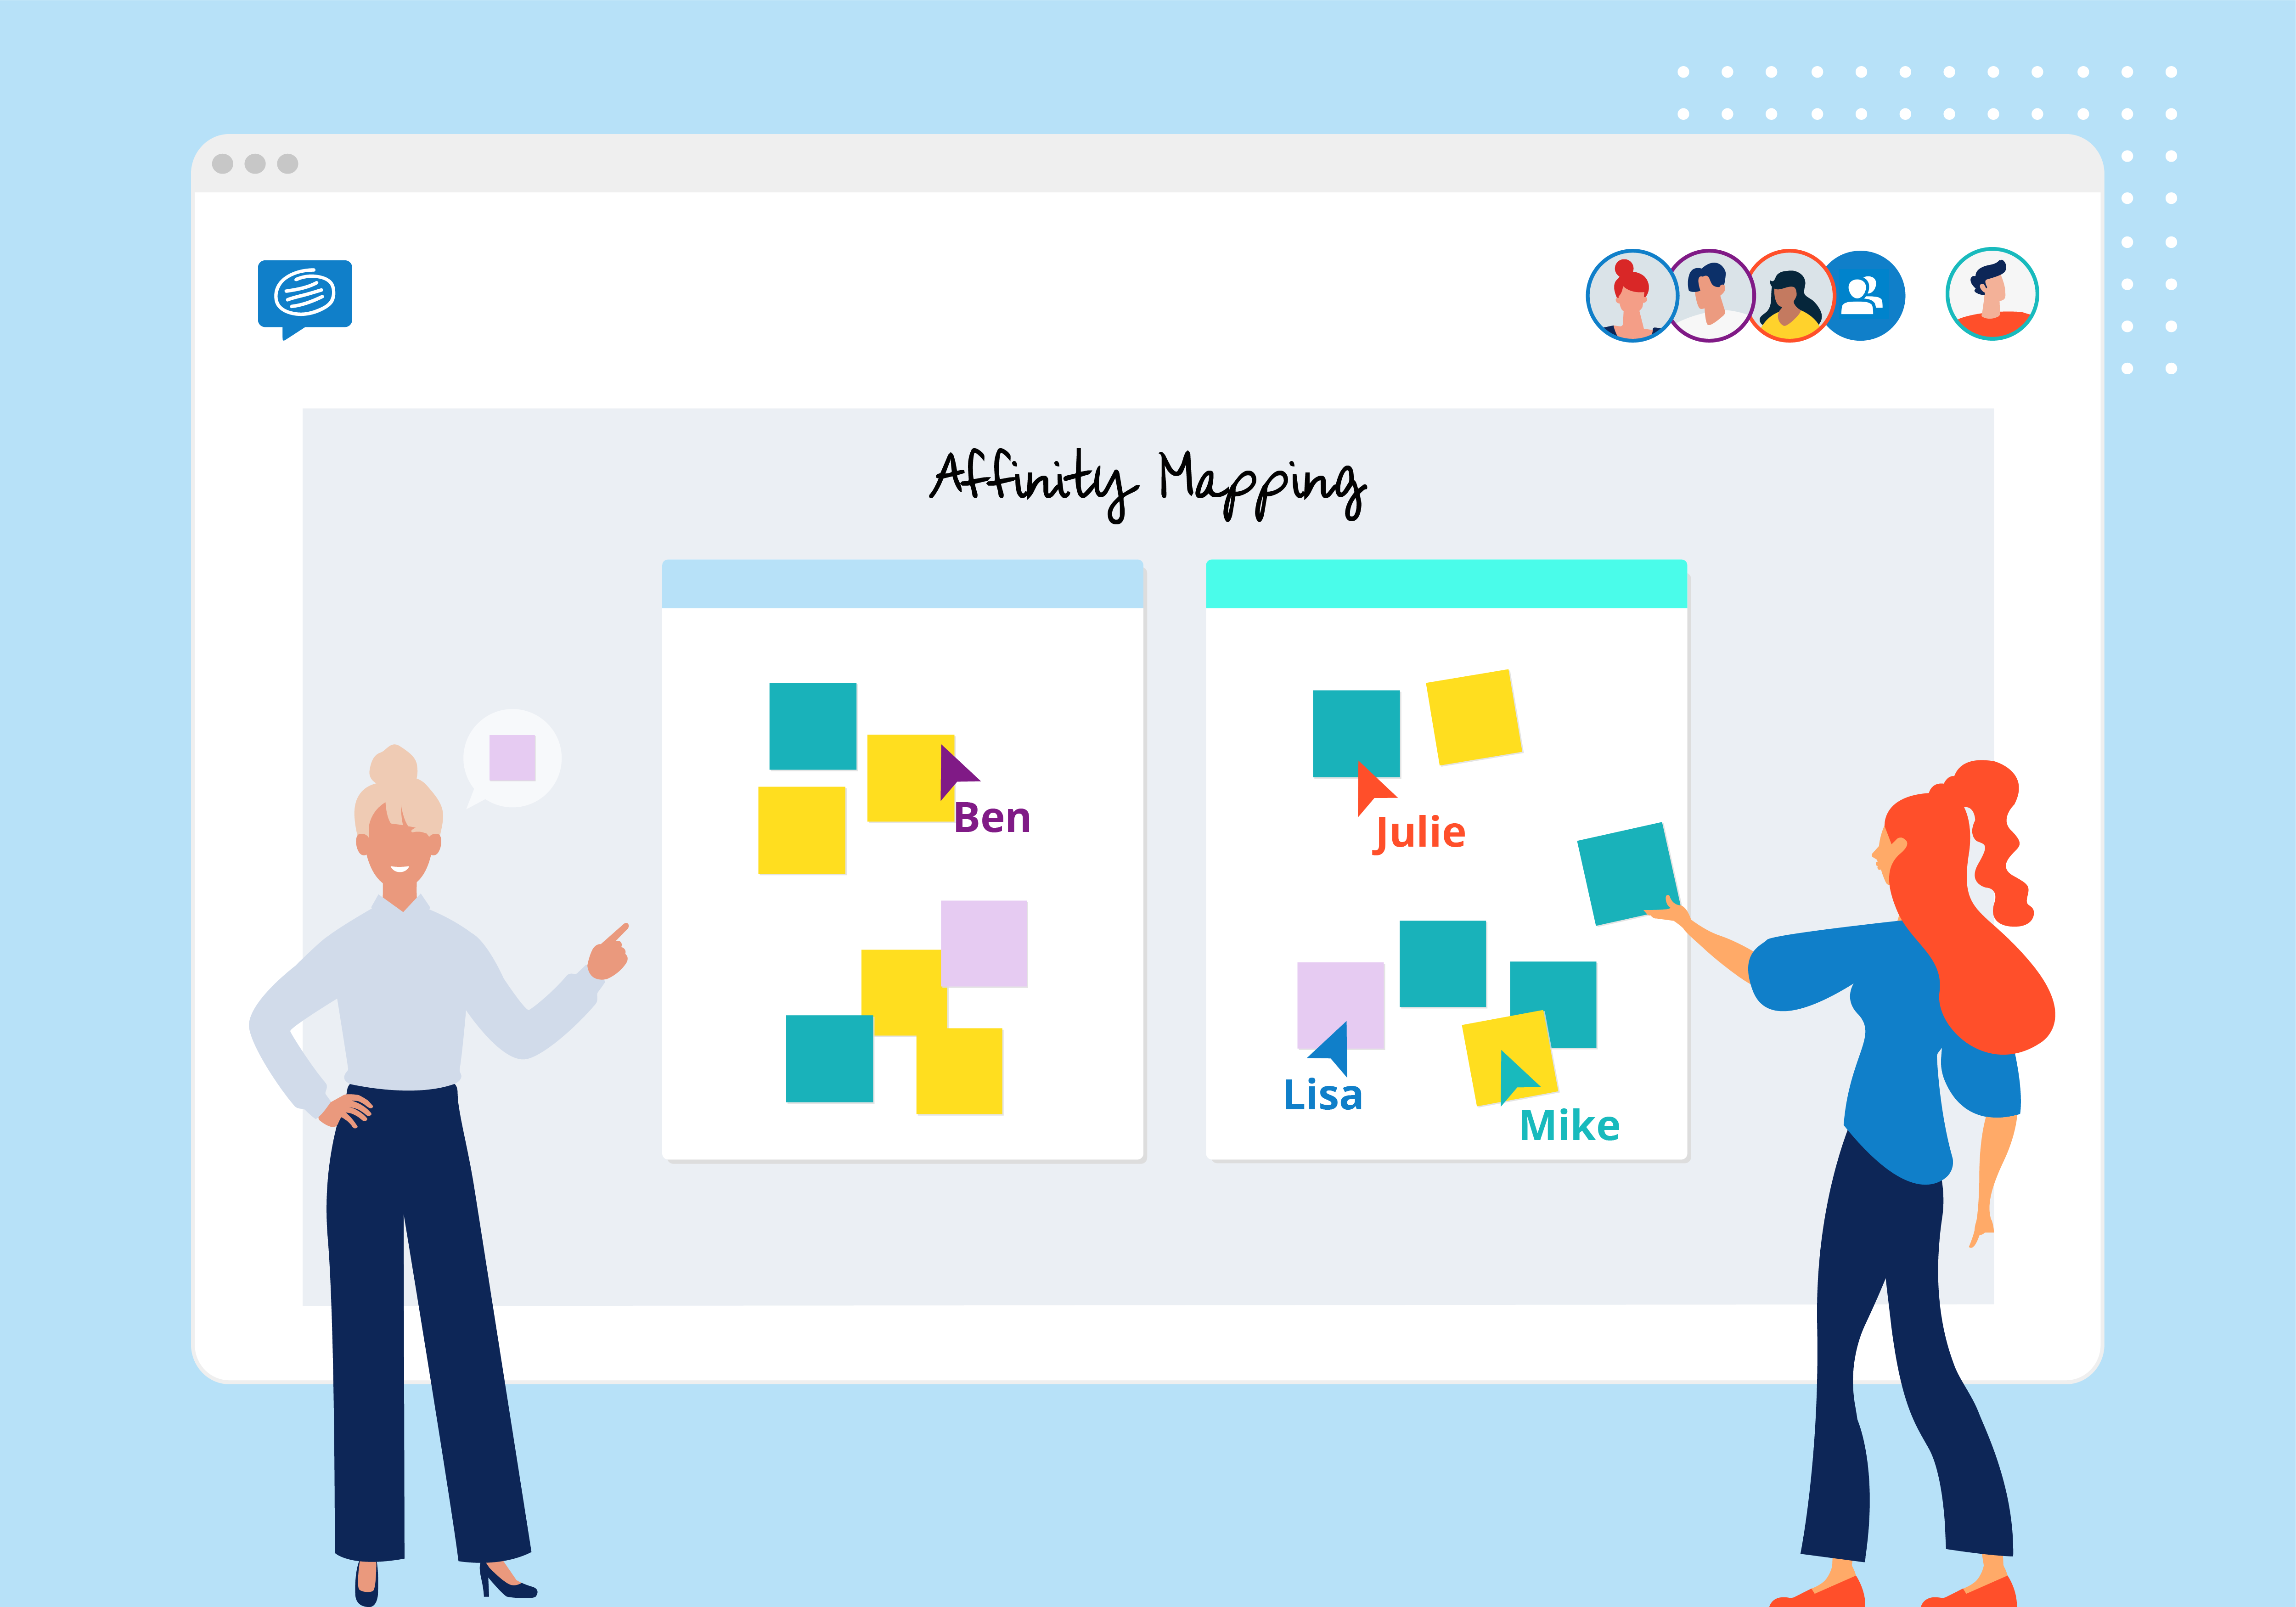
It is a visual map that organizes ideas into categorized clusters after the initial brainstorming. This process of creating affinity diagrams is known as affinity mapping. Affinity mapping allows all ideas to be strategically analyzed- instead of just focusing on one of two standouts. As clear themes start to emerge, you can consider multiple solutions to each problem.
We’ve created a simple affinity diagram template and guide you can use for your Affinity Diagrams. Read on to see how it works.

When to use an Affinity Diagram?
Affinity Diagrams are already widely used broadly within Design Thinking frameworks for a range of purposes, so why not give it a try and supercharge your collaborative problem solving. If you’d like to explore additional brainstorming techniques, we’ve rounded up 15 brainstorming techniques and templates you can use collaboratively with your team.
Affinity Diagrams for Brainstorming
Brainstorming is the most common application for Affinity Diagrams. It’s the organized second step, once the bulk of ideas have been generated. Sorting these ideas into categories can help synthesize results and find common affinities within the ideas.
Affinity Diagrams for Project Management
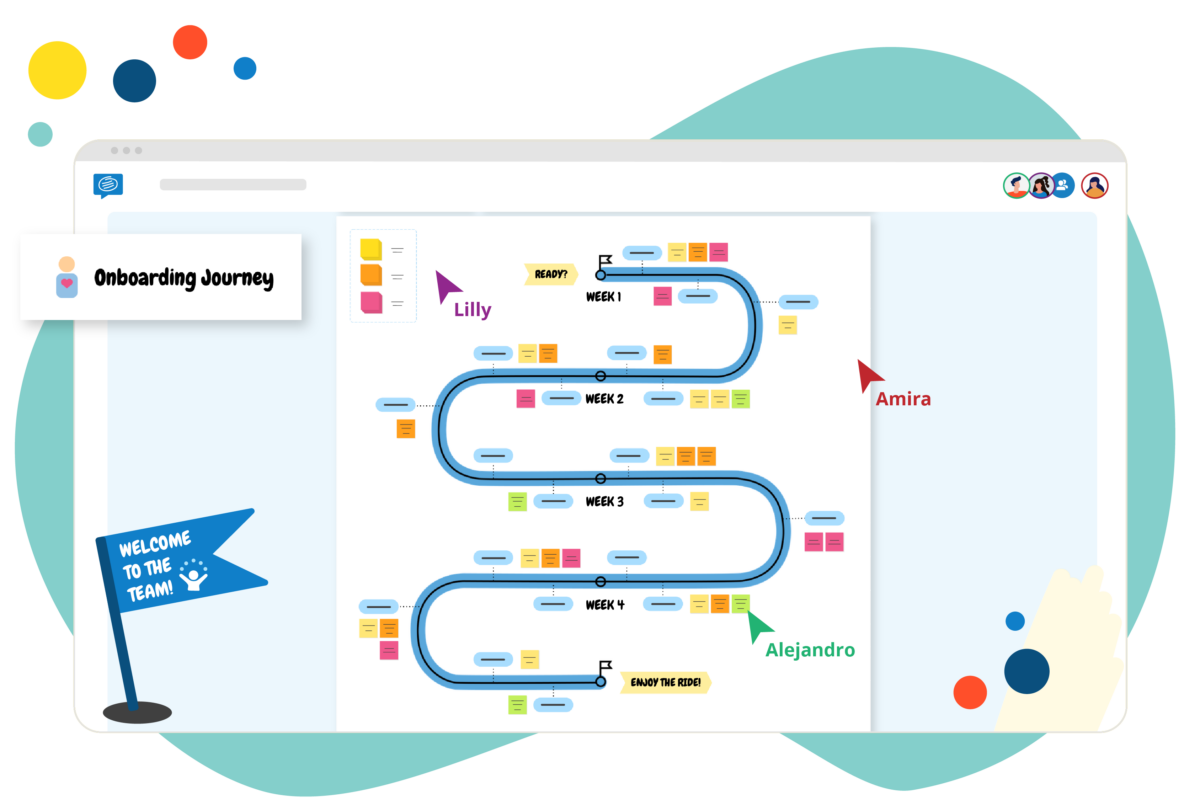
An affinity diagram may be utilized by project teams in manual project planning when working in an area with incomplete knowledge. For example, When there is a large amount of uncategorized data, or when you need to stimulate idea generation and new patterns of thinking.
Affinity Diagrams for Six Sigma
Six Sigma is a method that is aimed at improving any sort of business processes from manufacturing to transactions. Among the many tools used by Six Sigma project teams, the one that consistently is used successfully by all types of teams is the Affinity Diagram.
Affinity Diagrams for UX Design
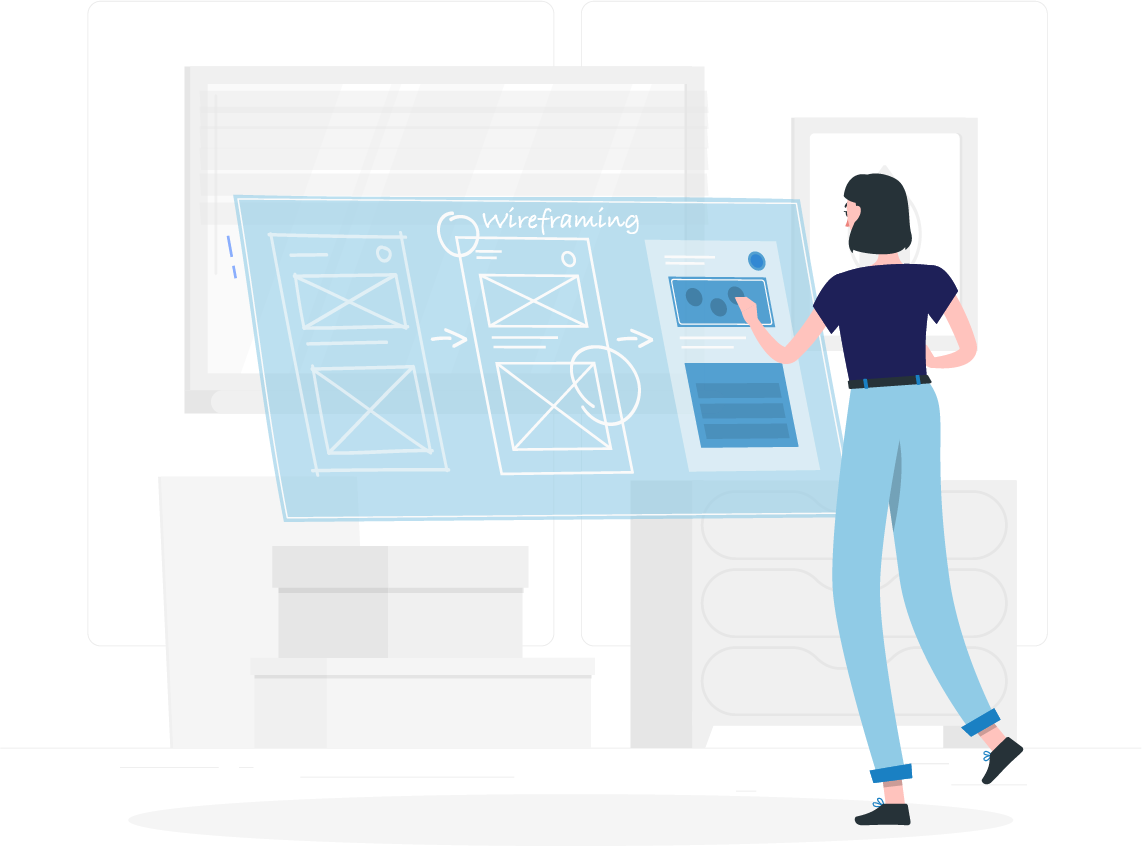
In UX Design, Affinity Diagram is used primarily by teams to quickly organize ideas about UX strategy and vision after a design-ideation meeting. It’s flow helps teams whittle down ideas until they have selected the one best idea in each category.
Discover visual collaboration
Online Affinity Diagram mapping process
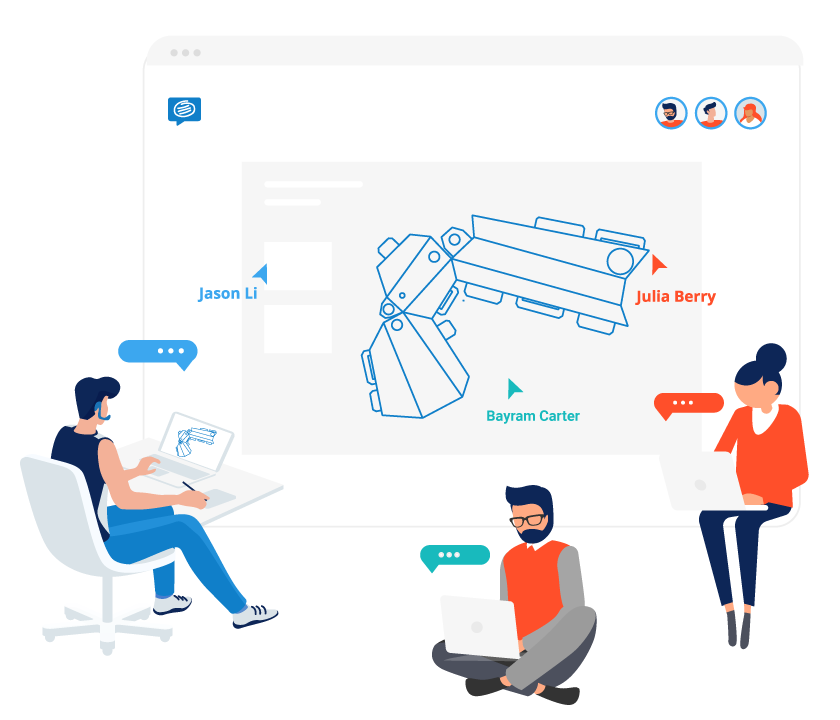
Affinity diagrams rely on Post-It notes to create the visual map. However, if your team is distributed, Conceptboard’s online whiteboard and digital sticky notes is the perfect tool to ensure your team can collaborate just as effectively online. Plus, once you’ve finished your map, you can export as a PDF, continue editing down the track or share with relevant stakeholders.
Introducing an online Affinity diagram into your remote brainstorming session is easy with our simple template. Watch the short video below to see it in action
We’ve broken the mapping process down into three main parts.
Step 1: Ideation
The first step of the process is the brainstorming. Define your problem, and give the team five minutes to brain dump all their ideas onto Sticky Notes in the empty large Brainstorming space. Alternatively, you can add one of our idea generation templates from the content sidebar such as:
Brainwriting
It’s a great idea generation technique that prioritizes participation and inclusivity. It’s also great for generating a large number of ideas in a short period of time. Try the brainwriting technique with our free template.
Lotus diagram
A lotus diagram is a great tool to lend structure to a brainstorming session. It focuses on using a grid structure in order to generate a wide range of ideas from a central theme.
Fishbone diagram
Also known as an Ishikawa diagram, a fishbone diagram is a cause and effect analysis tool used in a brainstorming session to drill down to the root of a problem. It’s a great addition to your collaborative problem solving toolkit.
Six thinking hats
This method focus on outside-the-box thinking for innovative problem solving. Six thinking hats is effectively used both in brainstorming as well as strategic decision making.
How Might We
How might we is an exercise used primarily in design thinking to reframe the problem as a challenge and focus on finding innovative solutions from different perspectives. Your How Might We could ideally become a launchpad for your brainstorming session.
Step 2: Diagraming
Next, it’s time to start looking at the ideas to find affinities and connections. It can help to talk through why you think ideas belong together and encourage discussion within the group. Be prepared for this step to take the longest, but eventually you will be able see a clear map emerge.
Once categories or themes have emerged, you can label the category areas and begin placing the sticky notes in the relevant categories.
The final step in the Affinity diagram is to select the final one or two ideas from each category and drag them into the lower Refinement area. Now, you should have identified exact solutions to your initial problems.
Step 3. Wrap-up
Once you have organized each group, think about the next steps and create a plan of action by assigning tasks to team members.
If you want to take it a step further, try adding the Action Priority or Priority Matrix templates to the board.